
Holt-Winters forecasting is a way to model and predict the behavior of a sequence of values over time—a time series. Holt-Winters is one of the most popular forecasting techniques for time series. It’s decades old, but it’s still ubiquitous in many applications, including monitoring, where it’s used for purposes such as anomaly detection and capacity planning.

Unfortunately, Holt-Winters forecasting is confusing, so it’s often poorly understood. We want to fix that, so we wrote this post: a visual introduction to Holt-Winters.
What Is the Holt-Winters Method?
Holt-Winters is a model of time series behavior. Forecasting always requires a model, and Holt-Winters is a way to model three aspects of the time series: a typical value (average), a slope (trend) over time, and a cyclical repeating pattern (seasonality).
Time series anomaly detection is a complicated problem with plenty of practical methods. It’s easy to get lost in all of the topics it encompasses. Learning them is certainly an issue, but implementing them is often more complicated. A key element of anomaly detection is forecasting—taking what you know about a time series, either based on a model or its history, and making decisions about values that arrive later.
You know how to do this already. Imagine someone asked you to forecast the prices for a certain stock, or the local temperature over the next few days. You could draw out your prediction, and chances are it’s a pretty good one. Your brain works amazingly well for problems like this, and our challenge is to try to get computers to do the same.
If you take an introductory course on time series, you’ll learn how to forecast by fitting a model to some sample data, and then using the model to predict future values. In practice, especially when monitoring systems, this approach doesn’t work well, if at all! Real systems rarely fit mathematical models. There’s an alternative. You can do something a lot simpler with exponential smoothing.
Holt-Winters Triple Exponential Smoothing Formula Explained
The Holt-Winters method uses exponential smoothing to encode lots of values from the past and use them to predict “typical” values for the present and future. Exponential smoothing refers to the use of an exponentially weighted moving average (EWMA) to “smooth” a time series. If you have some time series xt, you can define a new time series st that’s a smoothed version of xt.
st=αxt+(1−α)st−1
In the late 1950s, Charles Holt recognized the issue with the simple EWMA model with time series with trend. He modified the simple exponential smoothing model to account for a linear trend. This is known as Holt’s exponential smoothing. This model is a little more complicated. It consists of two EWMAs: one for the smoothed values of xt, and another for its slope. The terms level and trend are also used.
st=αxt+(1−α)(st−1+bt−1)
bt=β(st−st−1)+(1−β)bt−1
Notice how the smoothed values are much better at following the original time series with double exponential smoothing. This means you’ll get much better forecasts.
 To forecast with this model, you have to make a slight adjustment. Because there’s another term for the slope, you’ll have to consider that in the forecast. Suppose you’re trying to forecast the value in m time steps in the future. The formula for the m-step-ahead forecast, Ft+m, is:
Ft+m=st+mbt
Notice how it’s essentially the formula for a line. What if your time series doesn’t have a linear trend, but rather some sort of seasonality? For this, you’ll need yet another EWMA.
Holt’s student, Peter Winters, extended his teacher’s model by introducing an additional term to factor in seasonality. Notice how there’s another variable L, which depends on the period of the seasonality and has to be known in advance. The three aspects of the time series behavior—value, trend, and seasonality—are expressed as three types of exponential smoothing, so Holt-Winters is called triple exponential smoothing. The model predicts a current or future value by computing the combined effects of these three influences. The model requires several parameters: one for each smoothing (ɑ, β, γ), the length of a season, and the number of periods in a season.

Holt-Winters Forecasting Example
The hardest parts of Holt-Winters forecasting are understanding how the model works and choosing good parameters. To tackle the first, we’ll walk through an example model by doing Holt-Winters “by hand.”
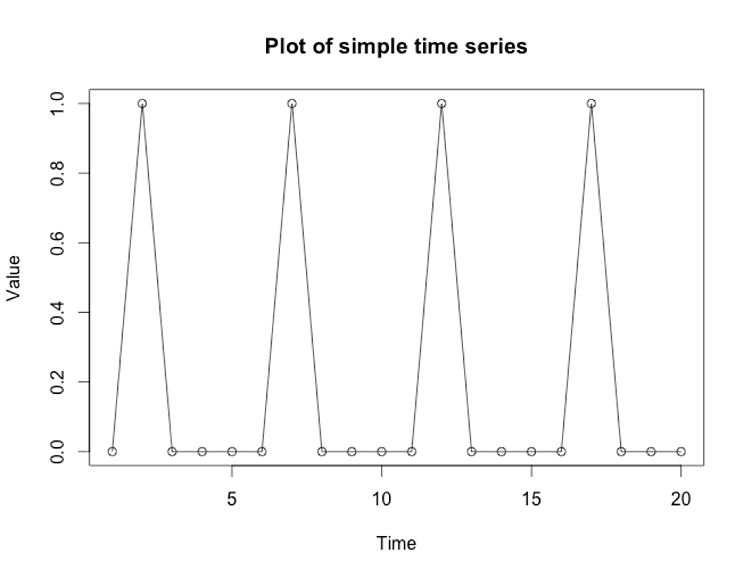
The usual way to explain Holt-Winters is by showing a bunch of complicated equations with Greek letters and subscripts. We’ll skip the math and show how it works, which is a lot simpler. We’re going to be working with this time series:
 Here’s the R code I used to generate that.
The pattern is obvious: the plot repeats the values [0, 1, 0, 0, 0]. Can you tell me what the next five values are going to be? Of course you can, because I just told you! They are [0, 1, 0, 0, 0]. What would it look like if we made the values relative to the average of those five points? The average of (0+1+0+0+0)/5 is 0.2, which we’ll draw on the plot as a horizontal line: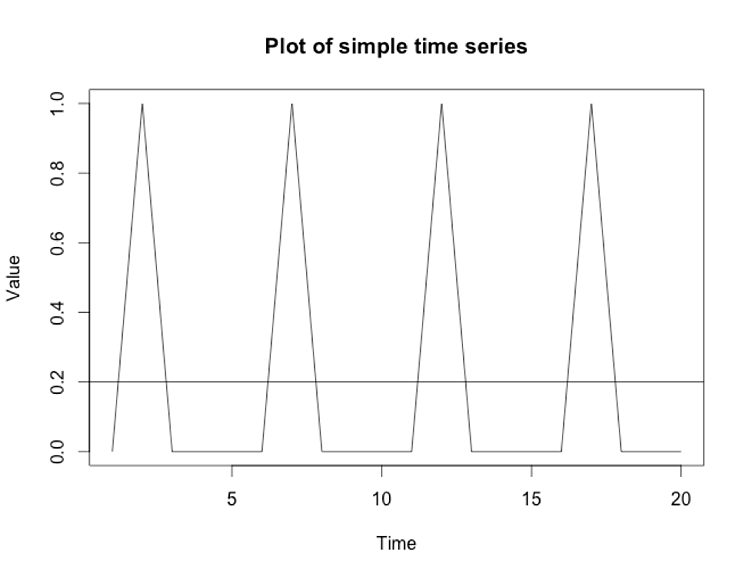 Holt-Winters has a trend component. If we set its parameter to zero, Holt-Winters ignores the trend (slope), so the model simplifies. Now, it’s just a bunch of values relative to the average. In our plot, the values relative to 0.2 are [-0.2, 0.8, -0.2, -0.2, -0.2]. If we did Holt-Winters without trend, that’s the type of model we’d build. Here’s what the Holt-Winters function in R gives, with some annotations in blue I added manually:
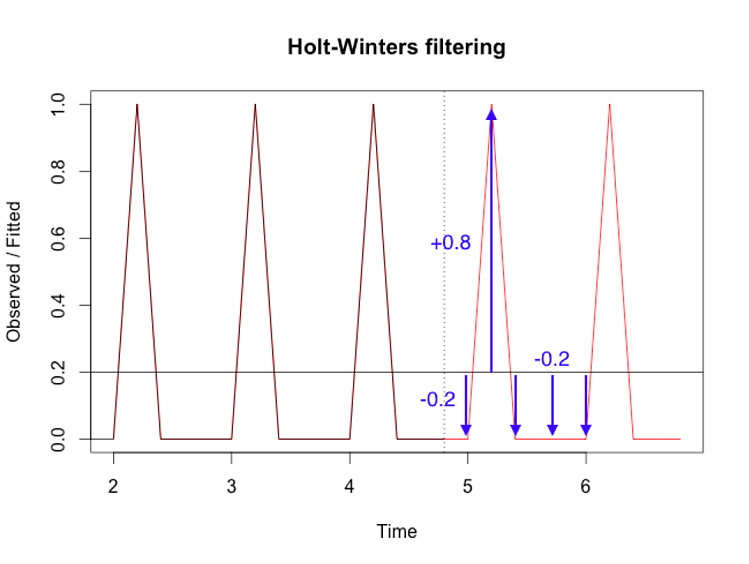 Forecasting with trend is just an enhancement of this. Instead of using a fixed average as the foundation, you have to incorporate the slope of the line. Here’s a model with a trend:
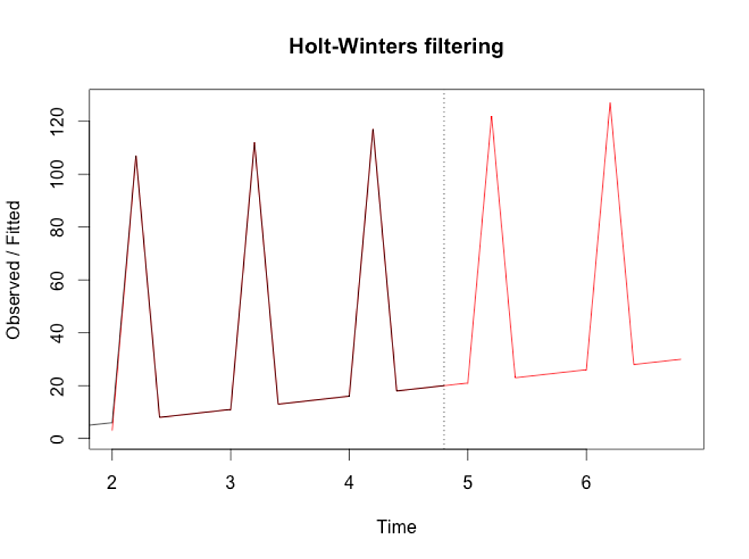
What Is Seasonality in Forecasting?
Seasonality refers to a periodic pattern or a fixed length of time containing the full repetition. However, seasonality can be confusing. You might think your data repeats daily (there’s a peak at 2 p.m. every day), but if the weekend has different behavior (there’s no peak at 2 p.m. on Sunday) then your season is really a week, not a day. Within the season, there are periods, which is the granularity of prediction. If you want to model a value for every hour of every day within a week, your season is 168 hours long and your period is 1 hour.
You already know, by definition, the example series repeats itself every five points, i.e., the season is five periods. What if you didn’t know what the season is for a time series? How can you figure it out? What are the consequences of being wrong? The right seasonality is crucial to Holt-Winters forecasting. To illustrate this, let’s see what happens when you use a season of six periods, one greater than the actual season of five periods: 
The forecast, which is the red line in the chart, becomes less accurate and turns into garbage. To get good results, you need to give the model good parameters. This is the second challenge with Holt-Winters forecasting.
Determining Optimal Parameters for Holt-Winters Formula Calculations
Picking the seasonality is a hard problem. General-purpose forecasting is hard because it has to be ready to use on any dataset, which might have any combination of values, trend, and seasonality. It might not even have some of those components. These are usually unknowns unless you’re manually inspecting the data and customizing the model for it.
At SolarWinds, we needed forecasting functionality that just works, without any assumptions or knowledge of the data’s characteristics. There are various approaches to this: machine learning, Fourier analysis, and so on. Our solution to this problem is to try lots of different combinations of things, using techniques like Nelder-Mead optimization to pick the winners. This takes advantage of computers being fast at simple things, so we formulate the problem simply: can I quantify how good a forecast is, and can I compare forecasts? Then we try different combinations of parameters and see what wins.
Let’s quantify how good a forecast is. The last forecast was bad, but how bad? The usual way to quantify the accuracy of a forecast is to calculate the differences between the predicted values and the actual values. The blue arrows in the following chart represent how far off the prediction was from the actual value.

To quantify overall accuracy, you can combine these differences into a single value by taking the average or the sum of squared values. The result is a value that’s smaller if the forecast is better, and larger if the forecast is worse. This gives you a good way to compare forecast results.
Our forecasting code tries lots of combinations (lots!) with different parameters and picks the ones that generate the lowest combined error score. To illustrate this, here are a bunch of forecasts on the same time series, trying out different frequencies.

The one with the right seasonality (five periods per season) is easy to pick out visually because the differences between the data and the forecast are small. This is a visual example of what our forecasting does through optimization. It also optimizes other parameters, such as the trend.
Holt-Winters Forecasting Method for Database Anomaly Detection
Holt-Winters forecasting is surprisingly powerful despite its simplicity. It can handle lots of complicated seasonal patterns by simply finding the central value, then adding in the effects of slope and seasonality. The trick is giving it the right parameters. This is a hard problem, but we’ve found numerical optimization can pick good values quickly. This solution is simple to build and understand, which is valuable for our purposes.
If you’re interested in exploring further, here are some other resources:
- https://www.otexts.org/fpp/7/5
- https://grisha.org/blog/2016/01/29/triple-exponential-smoothing-forecasting/
- http://www.itl.nist.gov/div898/handbook/pmc/section4/pmc435.htm
SolarWinds Database Performance Monitor offers query anomaly detection based on advanced statistical algorithms like Holt-Winters forecasting designed to account for several types of seasonality to better avoid false positives. Start a 14-day free trial of DPM to see this feature in action.